
Understanding Proximity Sensor Switching Frequency and Response Time
Introduction: Why Switching Speed Matters in Proximity Sensors
A proximity sensor that detects a stationary part can still miss it on a running machine: the moving target may leave the field before the sensor and controller resolve the event.
Switching frequency is the number of complete detection cycles a sensor repeats per second under its measurement conditions. Response time is the delay from a defined target change to the resulting output transition. Reliable detection needs three checks made together: the repetition rate, the shortest target-present and target-absent times, and the timing of the programmable logic controller (PLC) input that receives the signal.
What Is Proximity Sensor Switching Frequency?
Definition of Switching Frequency
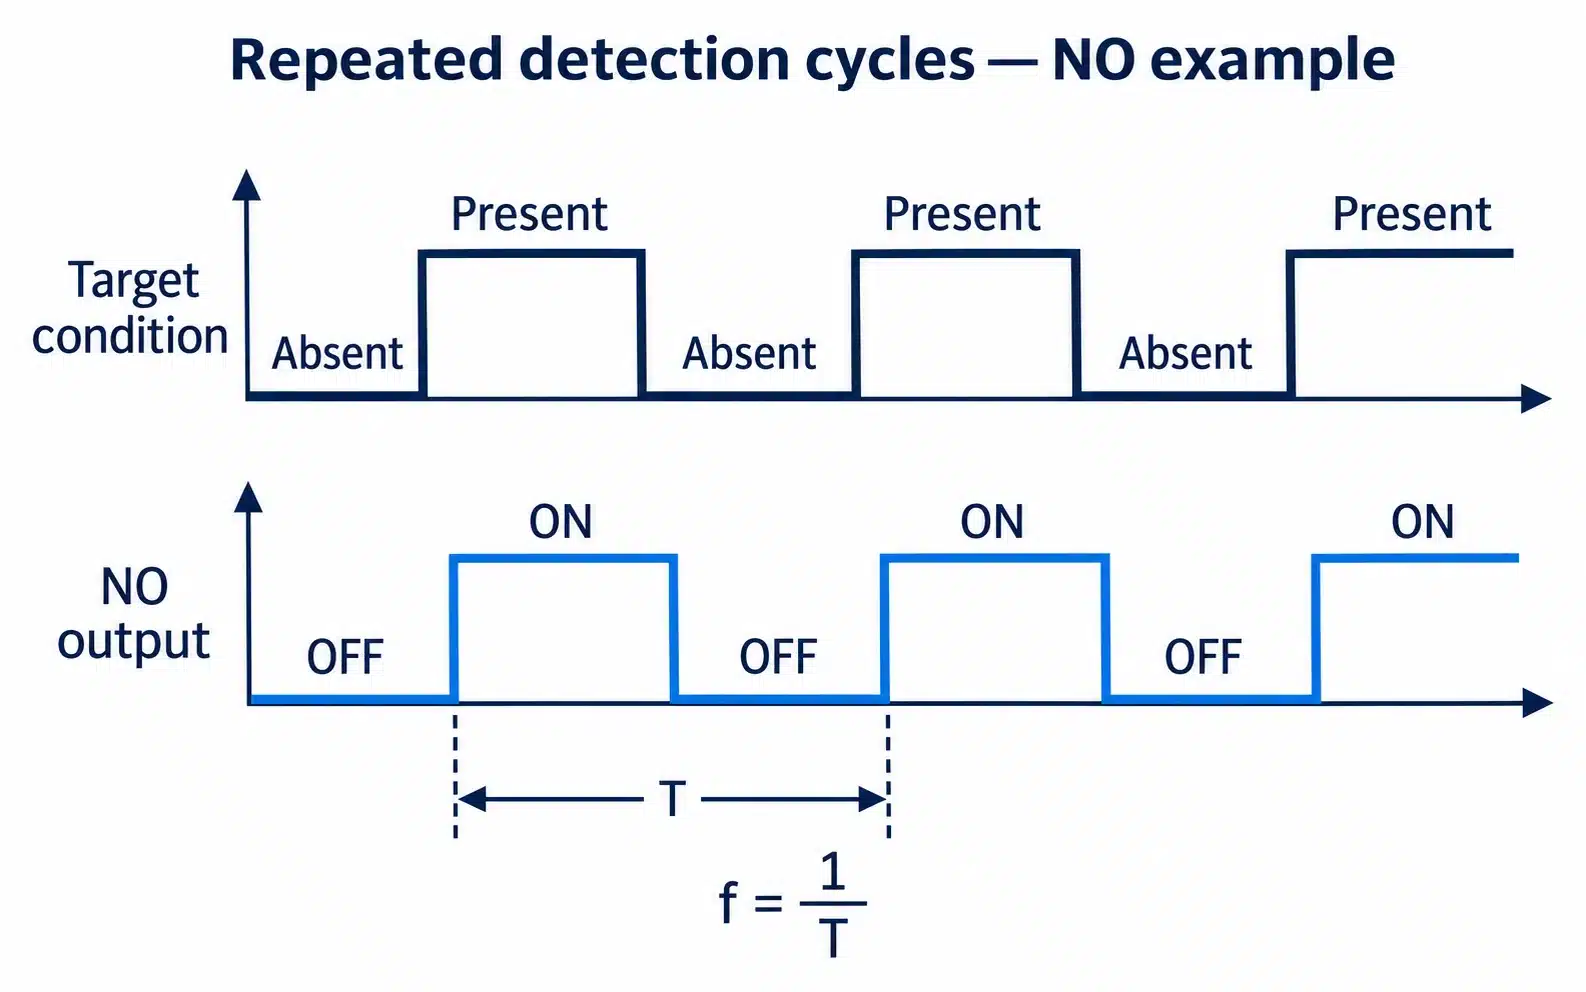
Switching frequency is stated in hertz (Hz), or cycles per second. OMRON defines response frequency through repeated detection of a standard target. A cycle includes detection and reset; its two output edges belong to one event. A 10 Hz sequence therefore contains 10 detections per second.
Check whether the value is maximum, nominal or average. OMRON’s E2F table, for example, footnotes response frequency as an average under specified reference-target and distance conditions. Do not convert that average into a guaranteed limit for every installation.
How Switching Frequency Is Measured
A historical Pepperl+Fuchs catalogue page describes the measurement it relates to EN 60947-5-2. Reference targets of defined material and size pass the sensing face at a defined spacing and distance while the output is monitored. The rated value is the highest repetition rate at which the output still follows the targets.
The measurement conditions determine how far a rating transfers to a machine. A small aluminium bracket crossing the field edge can present a different detection window and signal margin from the reference target. A representative trial resolves those differences.
Factors That Affect Switching Frequency
The sensing principle, processing, output stage and configured delays influence basic speed. Target material, size and operating gap influence the effective detection window and signal margin. Near the switching threshold, small variations can destabilize output. Field shape and hysteresis prevent a fixed percentage conversion from rated Hz to a different operating gap.
What Is Proximity Sensor Response Time?
Definition of Response Time
Response time is the delay from a defined target-condition change to the corresponding output change, usually in milliseconds (ms) or microseconds (μs). Sensor timing ends at its output. PLC filtering, input updates and program execution add separate delays. This guide covers conventional discrete sensing, not safety-function response validation.
ON Response Time vs. OFF Response Time
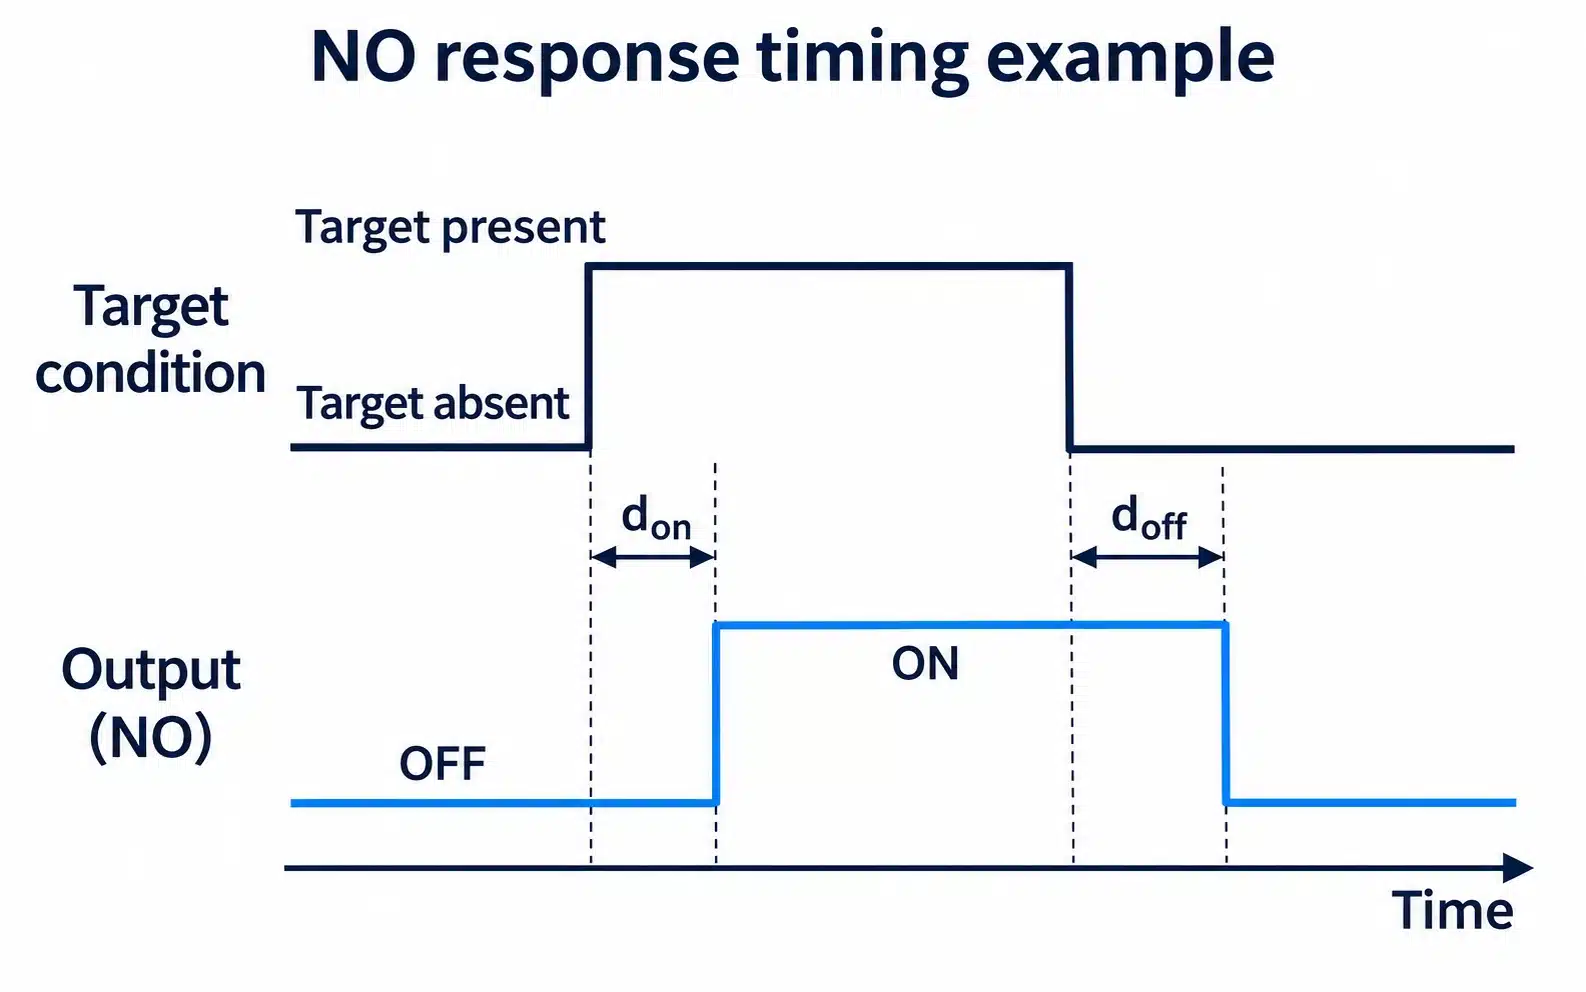
OMRON’s terminology guide illustrates response time with a normally open (NO) output. The output turns ON a short delay after the target enters and turns OFF a short delay after it leaves, and the two delays can differ. Only in a simple delayed-edge NO model, with both transitions actually occurring, does output-high width equal presence time plus OFF delay minus ON delay. A real device may suppress an event that is too short.
A normally closed (NC) output inverts the levels. It is ON while no target is present, target arrival produces a falling edge, and target departure produces a rising edge. A counter set to count rising edges on an NC signal therefore counts as each target leaves. Before assigning datasheet delays to an edge, confirm whether each figure refers to target arrival and departure or to the output turning ON and OFF.
Why Response Time Matters
At constant speed, a fixed 1 ms delay at 1 m/s corresponds to 1 mm of travel: an illustrative offset, not positioning accuracy. A stable offset may be compensated through trigger positioning. Jitter, the event-to-event delay variation, cannot be removed by a fixed correction. Counting needs every event captured; marking or rejecting also needs acceptable latency and variation.
Switching Frequency vs. Response Time: What Is the Difference?
| Comparison | Switching Frequency | Response Time |
|---|---|---|
| Meaning | Complete detection cycles per second under stated test conditions | Delay from a target change to a specified output transition |
| Unit | Hz or kHz | ms or μs |
| Qualifier to check | Maximum, nominal or average | Maximum or typical; ON, OFF or both |
| Main question | Can the sensor keep up with the event rate? | Is each pulse wide enough, and does it arrive in time? |
| Typical use | Counting repeated objects | Positioning, triggering and synchronization |
Frequency addresses repetition. Transition timing addresses whether target and separating intervals can be resolved and whether the signal arrives in time.
Are Switching Frequency and Response Time Directly Related?
Frequency is the reciprocal of a full repetition period, not one edge delay. The test includes both transitions and target-present/absent intervals; duty cycle and geometry also matter.
OMRON’s response-time FAQ estimates ON and OFF delays from response frequency using additional assumptions about how the cycle divides, and it states that actual delays are shorter than the estimate. That method is scoped to that manufacturer’s products. If an application depends on narrow pulses and only frequency is published, ask the supplier for the maximum ON and OFF delays or the minimum target and gap durations the sensor resolves.
How to Calculate the Required Switching Frequency for Your Application
Calculate Based on Object Speed and Spacing
For identical objects moving at constant speed past one sensing point, with one count per object:
f = v / p
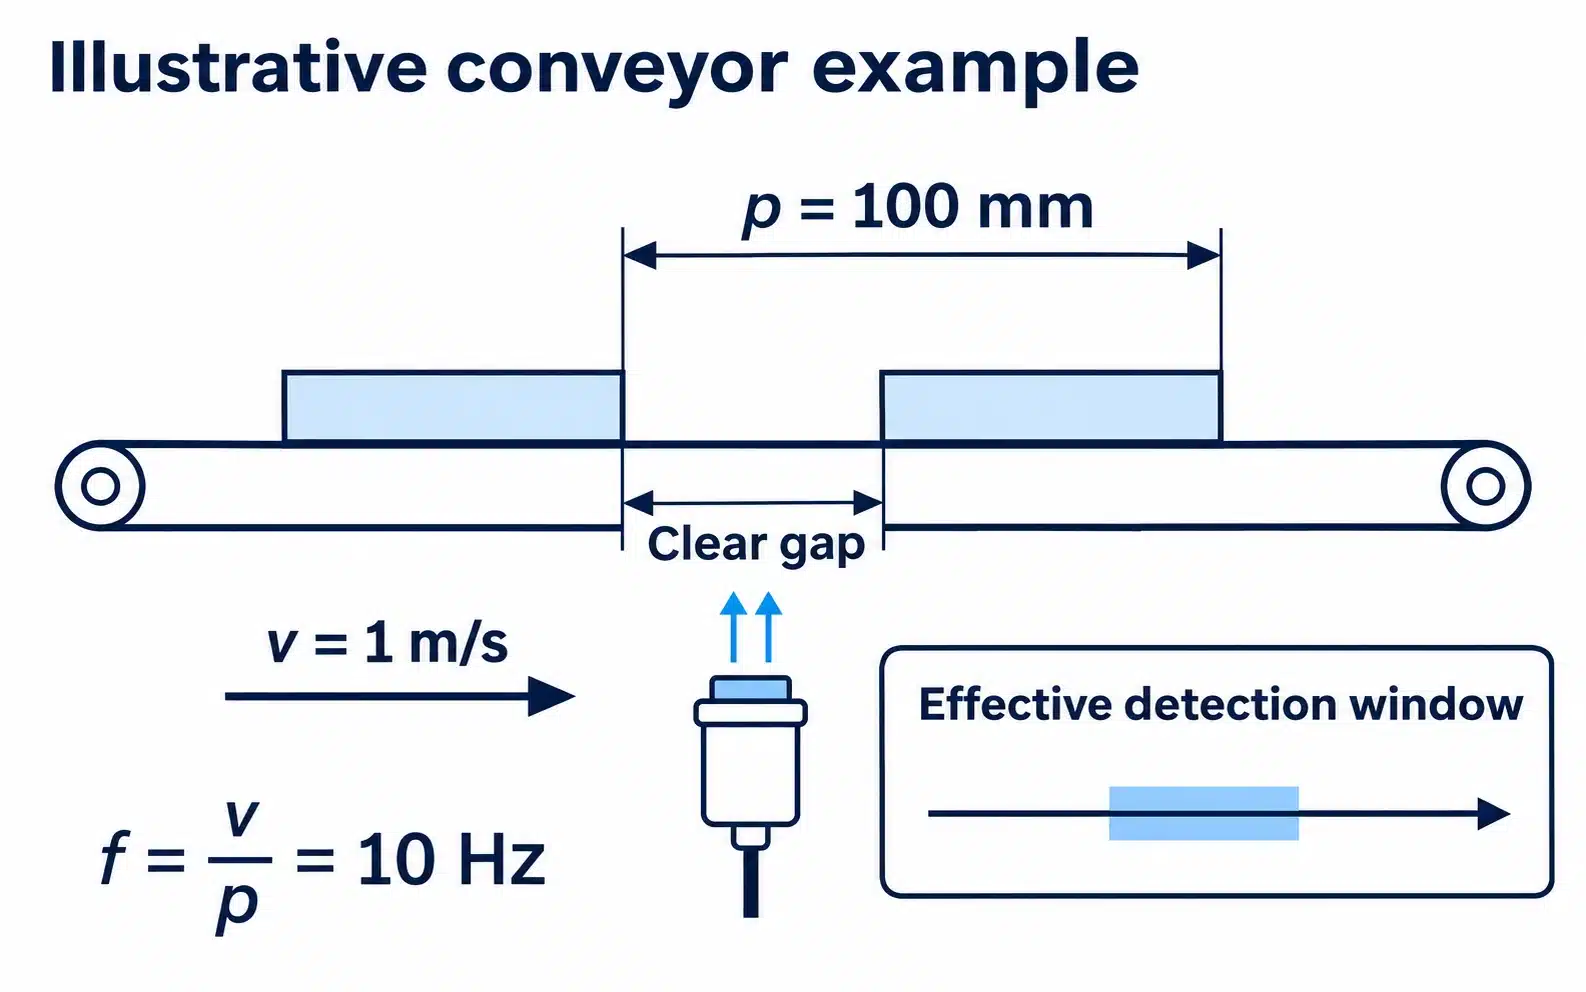
Here f is the required event rate in Hz, v is speed in m/s, and p is pitch in metres. Pitch is the distance between equivalent points on consecutive objects, usually leading edge to leading edge. The line moves one pitch per cycle, so the period is T = p / v and the event rate is f = 1 / T.
Clear gap is a different quantity: the empty space between one object’s trailing edge and the next object’s leading edge. For identical objects, pitch equals object length plus clear gap. On a hypothetical line with 40 mm parts and 60 mm gaps, pitch is 100 mm. Entering the 60 mm gap in the formula would give about 16.7 Hz at 1 m/s instead of the correct 10 Hz. The gap belongs in the target-absent calculation shown below.
With variable spacing, use the highest speed together with the shortest pitch that can occur. For a toothed wheel, multiply revolutions per second by the detectable teeth per revolution. A hypothetical shaft at 600 rpm (10 revolutions per second) with 6 teeth produces 60 Hz.
Worked Example: Detecting Parts on a Conveyor
Take a hypothetical conveyor running at 1 m/s with a leading-edge pitch of 100 mm (0.1 m):
f = 1 / 0.1 = 10 Hz
A part arrives every 100 ms. Pulse width depends on the effective detection window, w, which is the travel distance over which the sensor treats the target as present. At constant speed, presence time is w / v and absence time is (p − w) / v. Two assumed windows on the same line show the effect:
- w = 2 mm: present for 2 ms, absent for 98 ms.
- w = 20 mm: present for 20 ms, absent for 80 ms.
Both cases run at 10 Hz, yet their ideal target-presence intervals differ tenfold. Actual output pulses depend on transition delays and whether the sensor resolves each event; compare measured electrical widths with the input’s limits. These windows are illustrative assumptions, not XSZ data, measurements or catalogue sensing distances. The real window depends on target shape and material, lateral position, operating gap and hysteresis, and is best measured on a representative target. Size the margin from worst-case speed, spacing tolerance and observed timing variation, because no universal multiplier makes a short pulse reliable.
How to Evaluate Response Time Requirements
Check repetition against the rated conditions, target-present/absent intervals against the sensor’s timing requirements, and resulting electrical pulses against controller capture limits. Keep event rate, output pulse width, fixed latency and jitter separate: they answer different questions.
Two PLC mechanisms need separate checks. Filtering can suppress short states; Siemens’ S7-1200 documentation explains that filtering also matters for high-speed counter inputs. With cyclic process-image polling, a pulse occurring entirely between observations may be missed. Suitable hardware capture, such as an appropriately configured high-speed counter (HSC), can avoid polling loss within its specified limits. It does not automatically bypass filtering. Check the exact module’s minimum high/low widths, filter and capture method; change settings through the commissioning procedure.
For positioning, add the filter delay, the input update or interrupt latency and the program execution time to the sensor delay. Then separate the repeatable part of that total from its variation.
Switching Frequency of Different Proximity Sensor Types
| Sensor Type | Typical Application | Key Considerations |
|---|---|---|
| Inductive proximity sensor | Metal targets such as cams, brackets and gear teeth | Target metal and size compared with the reference target, operating gap, and the selected model’s rating conditions |
| Capacitive proximity sensor | Metal or non-metal targets, including some level detection | Material properties, sensitivity adjustment, build-up on the sensing face and model-specific timing |
| Magnetic proximity sensor | A magnet or magnetic field, such as a magnet on a cylinder piston | Magnet strength and orientation, the switching element used and the stated timing conditions |
The technology name describes how a sensor detects a target. It does not rank sensors by speed, because ratings vary between models of the same type and depend on their test conditions. Housing size and output type, such as PNP, do not establish a high-speed rating either. Compare individual models against the application’s event rate and pulse widths.
What Happens When Switching Frequency Is Too Low?
The quickest diagnosis compares three records: actual target passages, the waveform at the sensor output, and what the PLC registers.
Missed Object Detection
When targets arrive faster than the sensor can cycle, or a presence time is shorter than the sensor can resolve, the output skips or merges pulses. If the sensor output shows every target but the controller still misses some, the loss is downstream of the sensor.
Incorrect Object Counting
If the sensor output is wrong, the counter has nothing correct to count, and the sensor setup or model needs attention. If the output is correct but the count is not, check the input filter, the scan-based capture, the counting edge and the program logic. Finding the stage that loses the event avoids replacing a sensor that is working.
Delayed PLC Signals
A signal can be counted correctly and still arrive too late for a reject or positioning action. The cause is latency, which the repetition rate does not describe. Measure from the sensor edge to input recognition and then to the control action. The filter or scan may contribute more delay than the sensor.
Unstable Detection at High Speeds
A target passing near the edge of the field gives a weak, short signal. Small changes in vibration, gap or target position then decide whether the output switches. A sensor with a higher frequency rating will not necessarily cure this. Better alignment, a smaller gap or more consistent target presentation often will.
How to Choose a High-Speed Proximity Sensor
Work from the application toward the controller:
- Rated switching frequency: compare the worst-case event rate with the published value, its qualifier and its test conditions.
- ON/OFF response time: obtain both delays, or the minimum target and gap durations, when short pulses dominate.
- Sensing distance: set a usable operating gap for the actual target with margin, rather than using the largest catalogue figure.
- Target material and dimensions: confirm that the reference-target rating applies, or plan a representative trial.
- NPN or PNP output: match the PLC input type and complete the current path. Polarity does not define speed.
- NO or NC logic: confirm which edge represents the event and count on that edge.
- Operating voltage: check the supply and load against both sensor and input requirements.
- PLC input response and filtering: check minimum high and low durations, filter setting, scan or interrupt capture and counting capability.
- Installation and detection accuracy: allow for alignment, vibration, target tolerance and the permissible position or timing error.
For the 10 Hz example, a figure above 10 Hz meets only the nominal rate comparison; its qualifier and test conditions still matter. A 2 mm effective window gives 2 ms of ideal target presence, not automatically a 2 ms electrical pulse. If measured output pulses are valid but the input misses them, investigate controller capture and filtering before replacing the sensor.
Validate at maximum speed, minimum pitch and shortest relevant clear gap, maximum sensor-to-target operating gap, and representative target variation. Pass a known number of targets and compare that number with the sensor transitions and the recorded count. For positioning, record the spread of trigger positions. Document the sensor model and suffix, wiring, input settings and waveforms so the result applies to a reproducible configuration.
Frequently Asked Questions
What Is a Good Switching Frequency for a Proximity Sensor?
A good value exceeds your worst-case event rate under conditions close to the rated test, while the sensor and PLC input also resolve your shortest pulses. Target size and pitch change both requirements, so no single Hz figure suits every application.
Is Higher Switching Frequency Always Better?
No. A higher rating helps when repetition rate is the limit. It does not fix an excessive gap, poor target presentation, a long input filter or an incompatible input.
What Is the Difference Between Switching Frequency and Response Time?
Switching frequency counts complete detection cycles per second. Response time is the delay from a target change to one specific output transition. Each cycle contains two transitions and the intervals between them.
Can a Proximity Sensor Detect Fast-Moving Metal Objects?
Yes, and an inductive sensor is the usual candidate. Whether a given model works depends on the metal, target size, operating gap, event rate and pulse capture at the PLC. Detection at rest does not prove detection at speed.
Does Sensing Distance Affect Switching Frequency?
The operating gap changes the effective detection window and signal strength, which affects pulse width and stability. No universal rule converts a gap change into a new Hz rating, so compare your setup with the rated test conditions.
How Do I Know If My Proximity Sensor Is Suitable for High-Speed Applications?
Calculate the event rate and the shortest pulse widths, compare them with the sensor’s timing data and the PLC input’s limits, then run a count test at maximum speed. The sensor, input and counting configuration must pass together.
Conclusion: Match Sensor Speed to Your Application
Use frequency for repetition and response time for transition timing. Calculate event rate from pitch, assess the shortest detection intervals, and verify actual output pulses and recorded counts through the selected PLC input.
XSZ offers inductive and capacitive proximity sensor categories for industrial detection. Browse our inductive proximity sensors, or send our team your target material and size, maximum speed, minimum pitch, clear gap, installation gap and PLC input model so we can identify a model for evaluation.
Technical References
- OMRON: Proximity Sensors, Explanation of Terms: standard target, response frequency and the NO response-time diagram.
- OMRON: FAQ01074, Response Time: manufacturer-specific estimate of ON and OFF delays from response frequency, with its stated assumptions.
- OMRON: E2F Specifications: response frequency footnoted as an average value under stated reference-target and distance conditions; page updated 19 April 2017.
- Pepperl+Fuchs: Sensors and Systems catalogue, proximity sensor page: switching-frequency measurement arrangement with reference targets.
- Siemens: S7-1200, Configuring Digital Input Filter Times: input filtering and its relevance to high-speed counter inputs; documentation V20, November 2024.